
NXP Technology Days
AI That Knows When Not to Act: Trustworthy Physical AI at the Edge
A deployed model can stay confident after the product, lighting or process changes. Capsa adds a risk signal alongside the prediction so an edge system can act on familiar inputs and route the rest to human review.
Running live on the i.MX 8M Plus NPU · full INT8 · TensorFlow Lite 2.19 · eIQ VX delegate
The result in 30 seconds
44 / 151
known-good images auto-accepted
29.14% accept rate, 95% CI 22.0–37.1%
i.MX 8M Plus · full INT8145 / 150
defect images routed to a human
3.33% realized escape, 95% CI 1.09–7.61%
i.MX 8M Plus · full INT8+0.272 ms
added NPU inference time (+3.26%)
0.2717 ms absolute, 3.2590% — p50 of 200 runs
i.MX 8M Plus · full INT8Public VisA PCB1–3 test data, not a production line. Five of 150 defect images were accepted by the policy. Customer clearance and escape rates will depend on prevalence, product mix, process changes, deployment backend and the selected tolerance.
These are not yield, verification-labour, production-PPM or safety figures.
The gate was calibrated under a declared 10% escape tolerance — a one-sided 95% upper bound on escape, not a predicted outcome. The bound behind this operating point is 9.4%; the escape actually realized on the held-out half was 3.3%, alongside 4/151 false abstentions on known-good boards.
Those are point estimates for the i.MX 8M Plus running the full INT8 graph. The board's two execution paths are not distinguishable on this data: the defect result is identical on both (5 / 150, 3.33%, 95% CI 1.09–7.61% on both), and the acceptance intervals overlap with each point estimate falling inside the other's (29.14%, 95% CI 22.0–37.1% and 24.50%, 95% CI 17.9–32.2%). Quantization and precision shift score magnitude between them, which is why a threshold is calibrated on the path that will run it — see the methodology, and the per-backend rows further down.
Show what the gate sees
The classifier was trained on known-good images and has no defect head. Defect masks are used to score the benchmark, not to train or calibrate the gate. On defective boards, the classifier can remain confident while the separate risk map identifies where the input no longer fits what the model learned.
Defective board — VisA PCB1
Policy action not auto-accepted; sent to a human
Policy code ABSTAIN_NEW_SKU_OR_CAPTURE
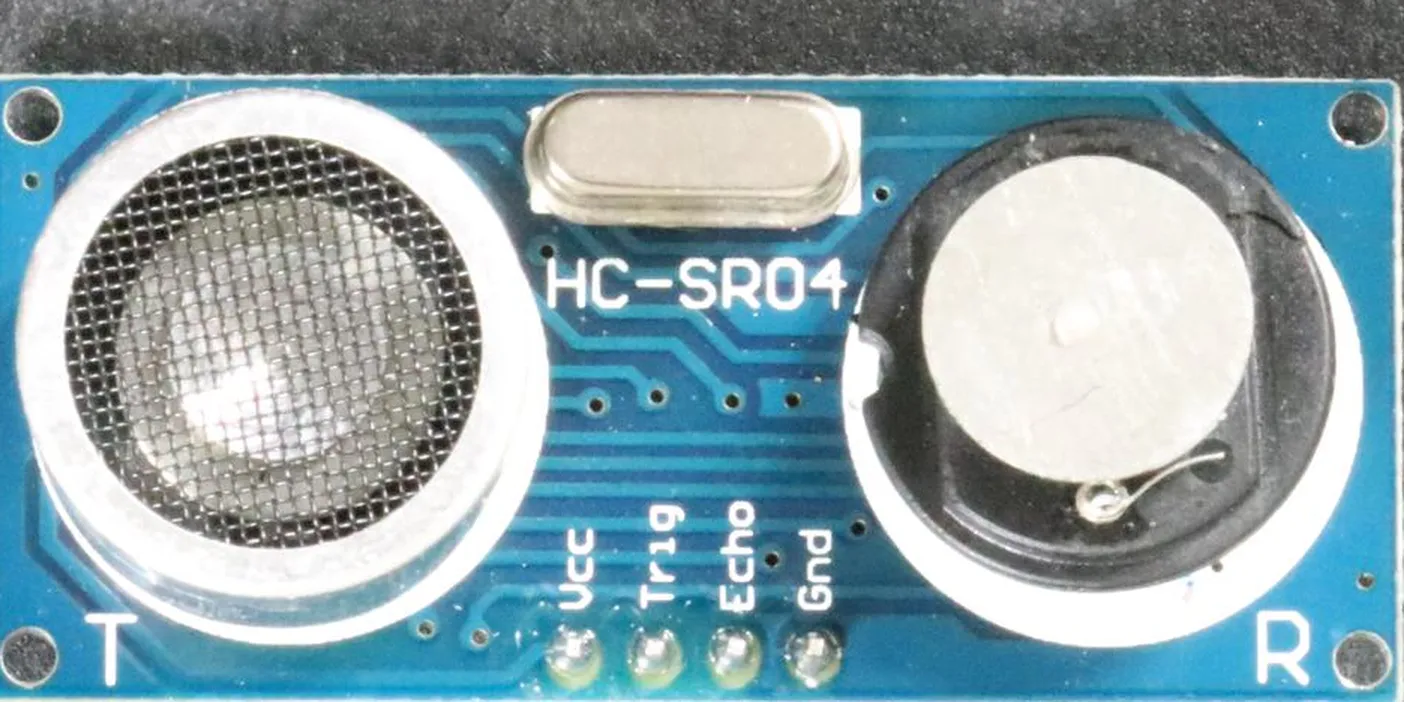
Input image
What the camera sees
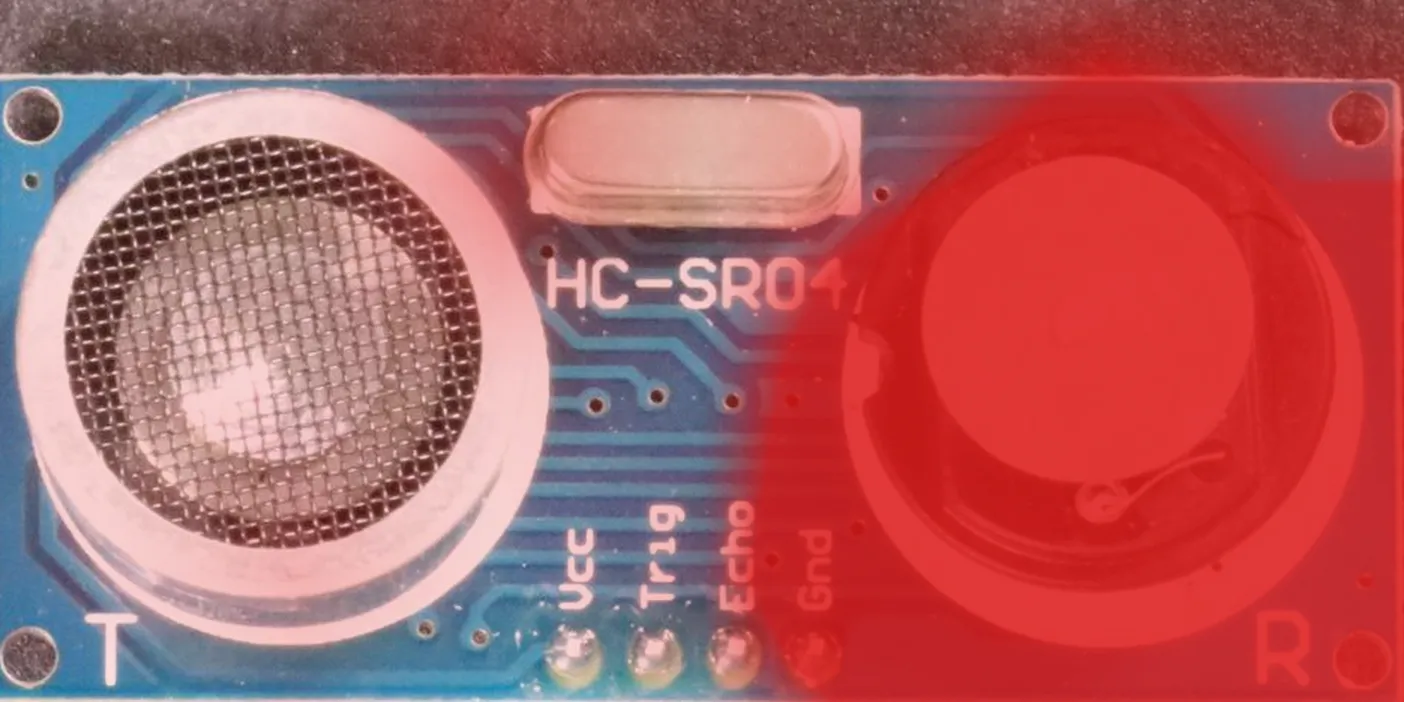
Capsa risk map
Opacity carries risk — clear is low, red is high
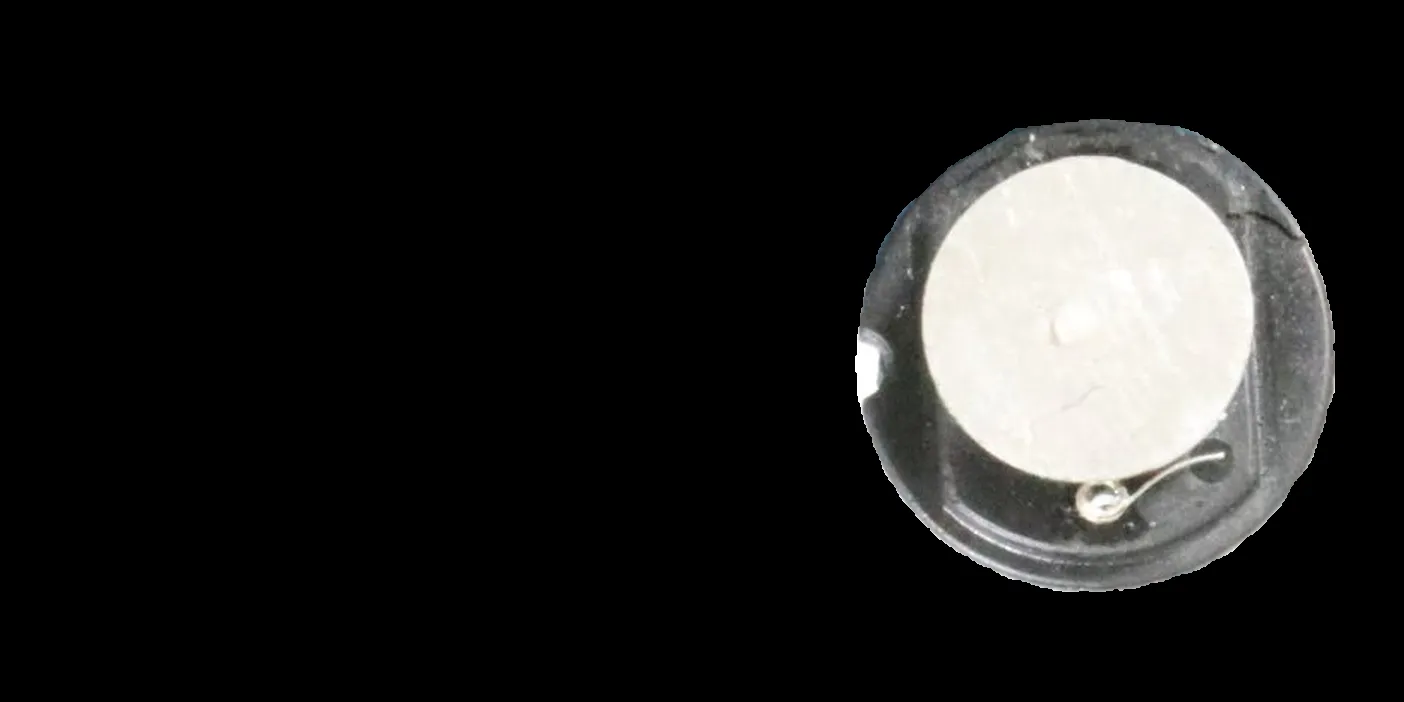
Ground-truth defect mask
The photograph inside the mask only — scoring, never trained on
Known-good board — VisA PCB1
Policy action cleared without human review
Policy code ACCEPT_MODEL_DECISION
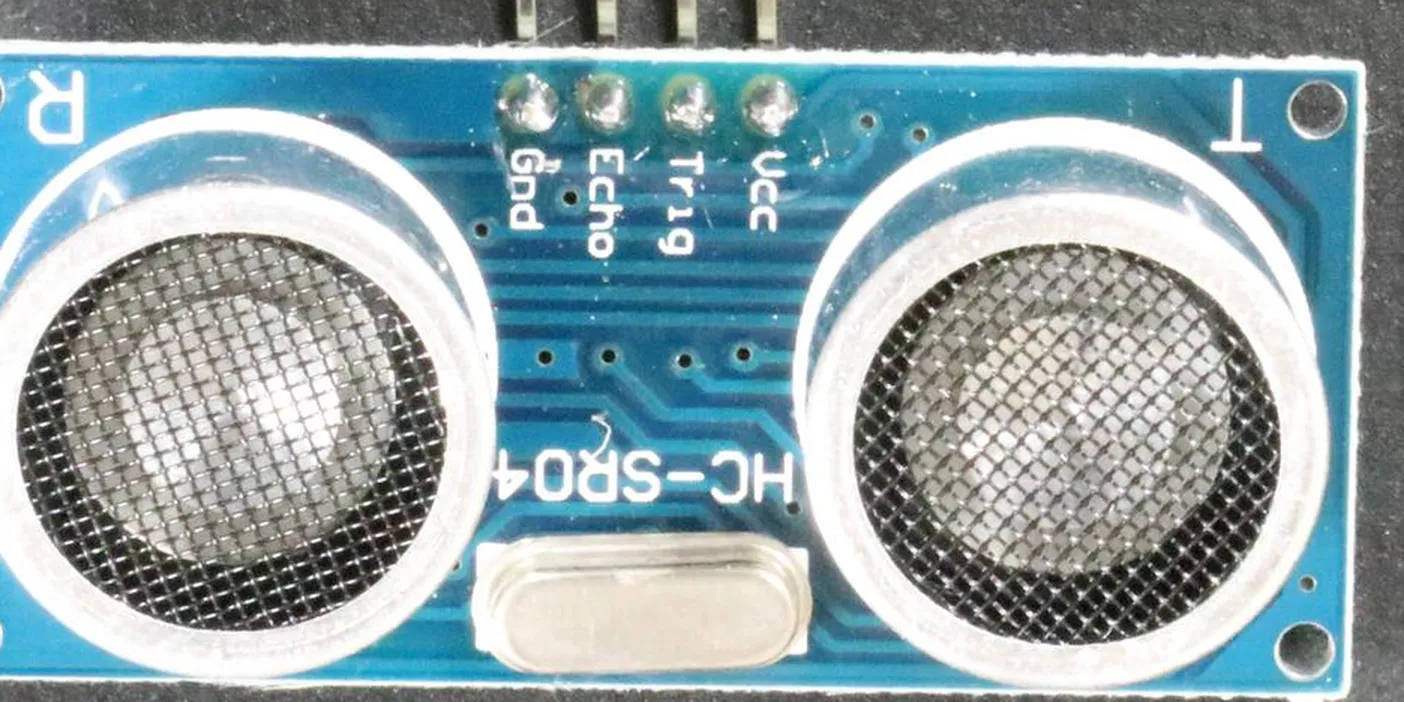
Input image
What the camera sees
Capsa risk map
Opacity carries risk — clear is low, red is high

Ground truth — no defect
Black because there is nothing to mark, not because it was left out
Both strips were produced from the deployed INT8 graph, which is bit-exact on the board's CPU. They are illustrative of the deployed gate; they are not a measurement taken on the NPU, and the pixel-AUROC figures below report the board backend separately. Images: VisA dataset, CC BY 4.0.
The risk map at its native resolution
The overlay above is blended with the photograph, so how hot it looks depends partly on the board underneath it. Drawn on its own, at the 7×7 resolution the model actually emits, the risk map is the tensor and nothing else — and that resolution is worth seeing plainly. The gate does not localize to a pixel; it scores 49 cells, and the smoothness of the overlay is interpolation, not evidence.
Both grids share one colour scale, so they can be compared directly: brighter is higher risk. 7 of the 49 cells cross the policy's own hot-cell threshold on the defective board and 0 cross it on the known-good one — that count over 49 is the abstain score the gate acts on. The defective board's peak cell is 4.6× the highest cell anywhere on the known-good board. Values are the channel-mean of the risk tensor over 640 channels, host INT8.
Localization quality by execution context
| Execution | Pixel-AUROC | 95% CI |
|---|---|---|
| FP32 host | 0.8874 | 0.849 – 0.916 |
| INT8 host | 0.8751 | 0.832 – 0.906 |
| INT8 board VX / NPU deployed | 0.8714 | 0.827 – 0.904 |
Intervals are 2,000-resample image-clustered bootstraps over the 150 defect images — the image, not the pixel, is the unit of resampling. The three rows are three different backends, not three runs of one.
Risk ranking survived NPU deployment: Spearman 0.992 between host INT8 and board VX. Quantization rescales the absolute risk magnitude but leaves the ordering of images essentially intact — which is why thresholds must be re-derived per backend while the underlying signal transfers.
Quality-only comparison
In a quality-only comparison, the board-VX Capsa map reached 0.871 pixel-AUROC versus 0.793 for host-FP32 PaDiM. PaDiM requires a separate feature pipeline that the deployed graph does not emit.
PaDiM was host FP32, was not deployed to the board, and was not latency-measured. This compares localization quality only — it is not a triage, throughput or review-reduction comparison, and no such comparison is claimed.
Tolerance, coverage and review budget
The full tolerance grid
Three declared tolerances were computed in the same locked pass, on all three backends. Only the highlighted row carries the predeclared comparison; every other cell is descriptive. The Host FP32 row at a declared 10% is the reason thresholds cannot be ported — the same tolerance overshoots to 7.3% realized escape on that backend.
| Backend | Declared | Bound | Cleared | Realized escape | Held unnec. |
|---|---|---|---|---|---|
| Host INT8 | 5% | 4.1% | 35 / 151 23.2% | 4 / 150 2.7% | 4 / 151 |
| Host INT8 primary | 10% | 9.4% | 44 / 151 29.1% | 5 / 150 3.3% | 4 / 151 |
| Host INT8 | 20% | 19.5% | 65 / 151 43.0% | 16 / 150 10.7% | 4 / 151 |
| Board NPU | 5% | 4.1% | 29 / 151 19.2% | 3 / 150 2.0% | 1 / 151 |
| Board NPU | 10% | 9.4% | 37 / 151 24.5% | 5 / 150 3.3% | 1 / 151 |
| Board NPU | 20% | 19.5% | 66 / 151 43.7% | 15 / 150 10.0% | 1 / 151 |
| Host FP32 | 5% | 4.1% | 29 / 151 19.2% | 1 / 150 0.7% | 2 / 151 |
| Host FP32 | 10% | 9.4% | 55 / 151 36.4% | 11 / 150 7.3% | 2 / 151 |
| Host FP32 | 20% | 19.5% | 79 / 151 52.3% | 17 / 150 11.3% | 2 / 151 |
There is no row tighter than 5%, and there cannot be one on this data. With zero observed escapes in 150 calibration defects the 95% upper bound is still 1.98%. A tolerance below that is undeclarable at this sample size; reaching a 1% bound needs at least 299 calibration defects. If your process needs a tolerance tighter than about 2%, the answer is a larger calibration set, not a different threshold rule.
The same gate, read as a detector
Everything above declares an escape tolerance and reports how much review is skipped. The same threshold family reads from the other end: declare a review budget, report what fraction of defects is caught. Both were computed in the same locked pass. This reading is descriptive and carries no comparison.
| Declared budget | Defects caught | ≥ at 95% conf. | Stream reviewed |
|---|---|---|---|
| 1% | unreachable at any threshold | ||
| 2% | 29 / 150 19.3% | 14.2% | 2.8% |
| 5% | 46 / 150 30.7% | 24.5% | 8.2% |
| 10% | 67 / 150 44.7% | 37.8% | 20.1% |
| 20% | 88 / 150 58.7% | 51.6% | 29.4% |
A negative result
Every reachable cell overshot its declared budget on the held-out half. Two structural reasons: the abstain action flags images whatever their verification score, putting a 2.8% floor under the budget, and the false-abstain rate moves from 1.3% on calibration to 2.6% on the held-out half. A review budget of a few percent cannot be calibrated from 150 images, whatever the score. That is a limit of the sample rather than of the method.
The two framings are one operating point read from opposite ends, and it matters which end is quoted. At the primary point the gate catches 145 / 150 defects (96.7%), and to do it sends 107 / 151 known-good boards (70.9%) to a person. That is the same fact as "clears 29.1% at 3.3% escape".
Illustrative projection, not a measurement. Applying the host-INT8 accept rate to a hypothetical stream that is 1% defective and 0.2% unseen-product gives 28.8% of inputs auto-accepted. That is arithmetic on the numbers above under assumed prevalence — it is not a measured clearance rate, not a labour saving, and not the share of this test set that was cleared.
What it costs, and what it leaves alone
| Measurement | Unwrapped | Capsa | Difference |
|---|---|---|---|
| i.MX 8M Plus NPU inference (p50, 200 runs) | 8.34 ms | 8.61 ms | +0.272 ms, +3.26% |
| Deployed artifact size | 2.71 MB | 3.15 MB | +0.447 MB, +16.5% |
- Same full-INT8 TensorFlow Lite / eIQ VX deployment path.
- No cloud calls in the inference path.
- Host-TFLite INT8 and board-CPU tensor values were bit-identical for the deployed artifact.
- Everything numerical in this section was measured on i.MX 8M Plus.
- Policy behavior was regression-tested against the reported decision logic.
The same TensorFlow Lite export format is consumed by eIQ Neutron on i.MX 93 and i.MX 95. This page does not claim that the model or performance numbers have been validated on those devices.
Equivalence of the Capsa export path and a hand-built export has been shown for this VisA model, on this backend. It is not claimed in general.
From public benchmark to your line
-
Bring the deployed model and backend.
The model you already ship, and the NXP part it runs on. We wrap the graph you have rather than asking for a retrain.
-
Provide process images, including known-good production.
Capsa can be fitted without defect masks, and the classifier behind this result was trained on known-good boards only. Labelled defects are required to select and validate an operating point with a declared escape tolerance.
-
Name the change condition and tolerance.
A new product variant, supplier, lighting rig, paste lot or facility — and the escape tolerance you are willing to declare.
-
Lock the threshold on the deployment backend, evaluate once on held-out data.
You get a coverage-versus-error curve and a proposed human-review policy, measured on the backend that will actually run it.
Measured lesson
Quantization preserved ranking but changed score magnitude. In this experiment, transferring a threshold across backends produced 21.3% escape against a 5% target, so thresholds must be calibrated and locked on the backend that will actually run them.
Capsa decides when an image needs review. It is not a safety function and does not set a PPM rate.
Relevance across the NXP customer base
Demonstrated
Electronics AOI and PCB inspection
An existing human-verification workflow, public PCB data, and the deployed i.MX 8M Plus proof described on this page.
Adjacent
Automotive parts, battery cells, pharmaceuticals, cosmetics
Visual inspection with the same shape of problem: a confident model, a changing process, and a human verification step worth spending selectively. Each requires evaluation on your own data — the PCB benchmark does not carry over as a result.
Adjacent
Wearables and physiological sensing
Themis has separate board-level work on physiological time-series models. No numerical claim is published for this class.
Adjacent
Condition monitoring and predictive maintenance
Earlier host-side time-series work, including eIQ Time Series Studio. Host-side only, and not a board-deployment claim.
One application is demonstrated. The other three are archetypes that share the problem shape — they are not results, and the PCB benchmark does not validate them.
Methodology and limitations
Dataset, denominators, intervals and the known weaknesses. Results snapshot: August 2026.
Dataset, split and denominators
Public VisA PCB1–3, held-out half (CC BY 4.0). Policy denominators are 151 known-good and 150 defective images. Localization is scored on the 150 defective images only — a pixel-AUROC needs a defect to localize.
- Known-good accepted: 44/151 host INT8, 37/151 board VX.
- Defect images accepted: 5/150 on both backends.
- False abstentions on known-good: 4/151 host INT8, 1/151 board VX.
- Pixel-AUROC: 150 defective images, all three backends.
Execution context and stack
Full INT8 · TensorFlow Lite 2.19 · eIQ VX delegate · i.MX 8M Plus. Latency is the p50 of 200 runs after 30 warm-up runs, against a matched unwrapped export built with the same architecture and the same INT8 post-training-quantization recipe, so the delta isolates the wrapper rather than the build.
Host FP32, host INT8 and board VX are three distinct backends with three distinct threshold sets. Numbers are never transferred between them on this page.
What the confidence intervals mean
Pixel-AUROC intervals are 95% image-clustered bootstrap intervals over 2,000 resamples of the 150 defect images. Pixels within an image are not independent, so the image is the unit of resampling; treating pixels as independent would produce intervals several times too narrow.
Policy-count intervals are Clopper-Pearson. With 150 defect images, 5 escapes span 1.1–7.6%; the interval is wide because the sample is small.
Declared tolerance versus realized rate
The operating point comes from policy pcb-neo-gate/1.2.0 at a declared 10% escape tolerance. A declared tolerance is a one-sided 95% upper bound derived on the calibration half — a promise about the worst case, not a prediction of the outcome. The bound behind this point is 9.4%. The realized escape on the held-out half was 3.3% (5/150).
Quoting the 10% escape tolerance as though it were the observed escape rate would overstate the error by roughly threefold.
Benchmark versus production
VisA PCB test material is roughly 50% defective. A real AOI station is orders of magnitude cleaner. Any projection to a production stream is arithmetic under an assumed prevalence, and is labelled as such wherever it appears here.
There is no false-call labelling, no production data and no external real-PCB dataset behind these numbers. Cross-line generalization is untested.
Thresholds are backend-specific
Capsa risk is an absolute magnitude and quantization rescales it. Transferring an INT8-derived threshold to another backend produced 21.3% escape against a 5% target. Ranking survives quantization (Spearman 0.992); calibration does not. Thresholds must be locked on the backend that will run them.
This is what separates the two acceptance figures above. The INT8 graph is bit-exact on the board's CPU, so 44 / 151 is a board result. The VX delegate preserves the ranking and routes the same 5 / 150 defects, but it rescales the absolute magnitude, so the same declared tolerance puts its threshold at a different quantile and it clears 37 / 151. The gap is where the threshold lands rather than a loss of signal — a precision and scaling effect, and the reason to calibrate on the delegate instead of porting a number to it.
Human-review policy, not safety certification
The policy triages whether a human looks at an image. It does not authorise disposal, establish a PPM rate, or certify a safety function. Nothing here is certified, and this result is not a certification.
Limits of the evidence
- Inherited model-selection bias. The checkpoint's training epoch was selected using pixel-AUROC on an anomaly pool that overlaps the test half, with an estimated magnitude of about 0.005 pixel-AUROC. The pixel-AUROC experiment is therefore not confirmatory, and is not described as such.
- The test half has been examined before. The thresholds never saw it and the primary comparison was declared in writing beforehand, but the split is not fresh. These results are locked-but-informed, not confirmatory.
- The unseen-product result proves nothing about Capsa. That benchmark is degenerate: the base model's own softmax — and even a mean-brightness rule — separates the unseen product perfectly. It is not evidence of an advantage over softmax, and no advantage is claimed from it.
- Sample size bounds what is declarable. With 150 calibration defects, the tightest tolerance that can be declared at all is about 2%. A 1% escape tolerance is unreachable at this sample size regardless of the score used.
- Per-product behaviour varies. Under one global threshold, per-product escape ranges 0–8%. A pooled bound says nothing about any single product line.
- PaDiM is host-FP32 only. It was never deployed or latency-measured; the comparison against it is localization quality only.
Bring us one difficult image and the backend you need to ship.
We will show what the gate sees, then define the data and tolerance required for a short evaluation on your process. An evaluation is a scoped piece of work — not a production decision made from one image.
Results snapshot: August 2026
NXP, i.MX and eIQ are trademarks of NXP Semiconductors. This page describes independent work by Themis AI and does not imply endorsement by NXP.